Device Details - Overview
The Overview tab provides essential information about your devices, helping you understand their capabilities, status, and specifications at a glance. Updated in version 2.1, the Overview tab has been reorganized for better clarity and usability.
Top section
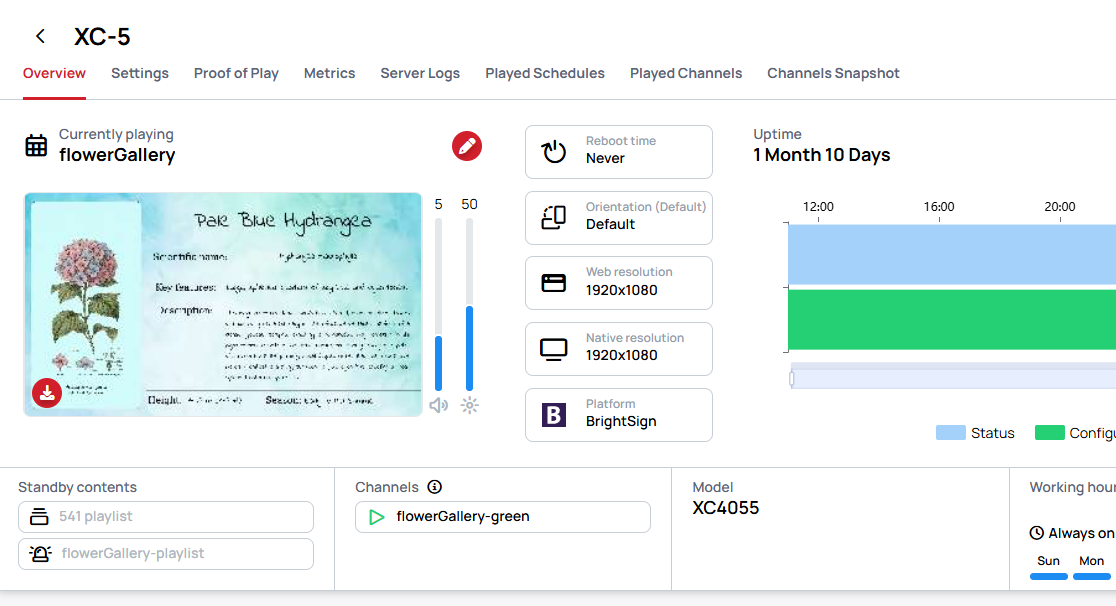
The top section of the Overview tab gives you an at-a-glance summary of the device's current state, organized into the following areas:
Content assignment
- Displays the assigned content name and its content type (e.g., Interactive Content, Slide, Playlist).
- A live content preview thumbnail is shown. Hover over the preview image and click the icon to view the latest content preview in full size.
- Click to
editthe assigned content. - Click to
previewthe assigned content.
Quick info cards
A set of info cards is displayed next to the content preview, providing key device settings at a glance:
- Reboot time — The configured automatic reboot schedule, or "Never" if not set.
- Orientation — The current screen rotation setting (e.g., Default, 90°, 180°, 270°).
- Web resolution — The resolution used by the Wallboard application.
- Native resolution — The physical display resolution of the device.
- Platform — The platform the device is running on (e.g., Windows, Android, BrightSign).
Uptime chart
The Uptime section displays a visual timeline chart showing the device's online/offline history for a selected time range (e.g., Last 24 hours). The chart uses color-coded indicators:
- Blue — Device online and operational
- Green — Configured working hours
- Red — Reconnection events
Next to the chart, you can see:
- Online status — Total time the device was online and uptime percentage.
- Reconnections — The number of times the device reconnected during the selected period.
Bottom cards
Below the content and uptime area, additional summary cards are displayed:
- Model — The hardware model of the device.
- Working hours — A visual weekly schedule showing when the device is configured to be active, along with the working hours mode (Device or Screen).
- Emergency content — Indicates whether emergency content is currently assigned to the device.
General information
The General Information section provides detailed Wallboard-related information about the device, organized into the following groups:
Device
- Device ID
- Service ID (max 15 characters): A unique identifier for the device that can be used for external services (e.g., TeamViewer ID). Only administrators can modify this field, while users with lower roles can view it.
- Hardware ID
- Brand
- Serial number (if available)
- App version
- OS version
- Firmware version and Firmware status
- WebView version
- Rooted (on Android devices)
- Root granted (on Android devices)
License
Licensed(yes/no): indicates whether the device has a license applied or the device is unlicensed.License tier: indicates which type of license is applied on the device (e.g., Lite, Professional, Premium, Video Wall).
Other
- Last activity
- Last application start
- Locked status
- Emergency status
- Debug settings
- WiFi network SSID
- Host name
- Time zone
- Commissioning date
- Replacement date
Debug settings
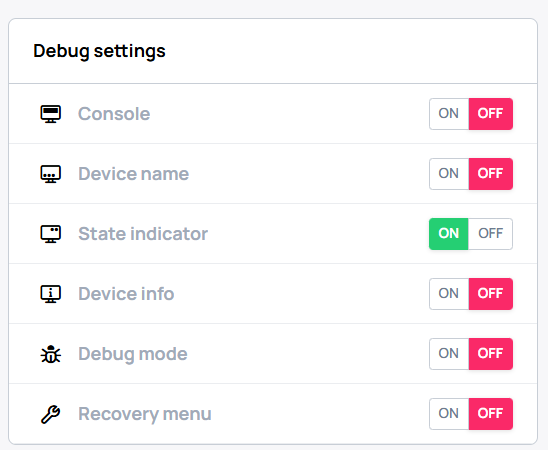
Here, you can see which debug settings are enabled on your device.
- Show console
- Show device name
- Show state indicator
- Show device info
Hardware information
In Hardware information you can find information about the selected device's CPU, Memory and Storage.
Network
In the Network section, you can find information about the selected device's network connectivity, including IP address, MAC address, BSSID, and connection type.
Displays
In the Displays section, you can see the connected displays attached to the device, including their resolution and additional information.
Sensor config
In the Sensor Config section, you can view and manage the sensor configuration of the device.
- You can view the
current sensor configby clicking on the icon.
Other
In Other, you can see additional device-related information such as architecture, computer name, and runtime versions.